Quick answer: Robot payback periods have shrunk from around 5 years to 12-18 months because hardware and deployment costs fell while labor, turnover and downtime costs rose, and modern robots can run multi-shift with high uptime. With AI fleet management, predictive maintenance and multi-task fleets spanning reception, cleaning, serving and AMRs, well-planned deployments offset staffing and inefficiency costs far faster than early single-task pilots.
For operations, finance and facility leaders, the robot payback period is no longer a speculative five-year bet. Across corporate campuses, government facilities, retail, education, healthcare, hospitality, manufacturing, logistics and airports, well-scoped robotics ROI now lands in 12-18 months. This article explains what collapsed the payback curve, where fast payback happens by use case, and how to estimate it for your own staffing, foot-traffic and maintenance footprint.
Why the Average Robot Payback Period Collapsed
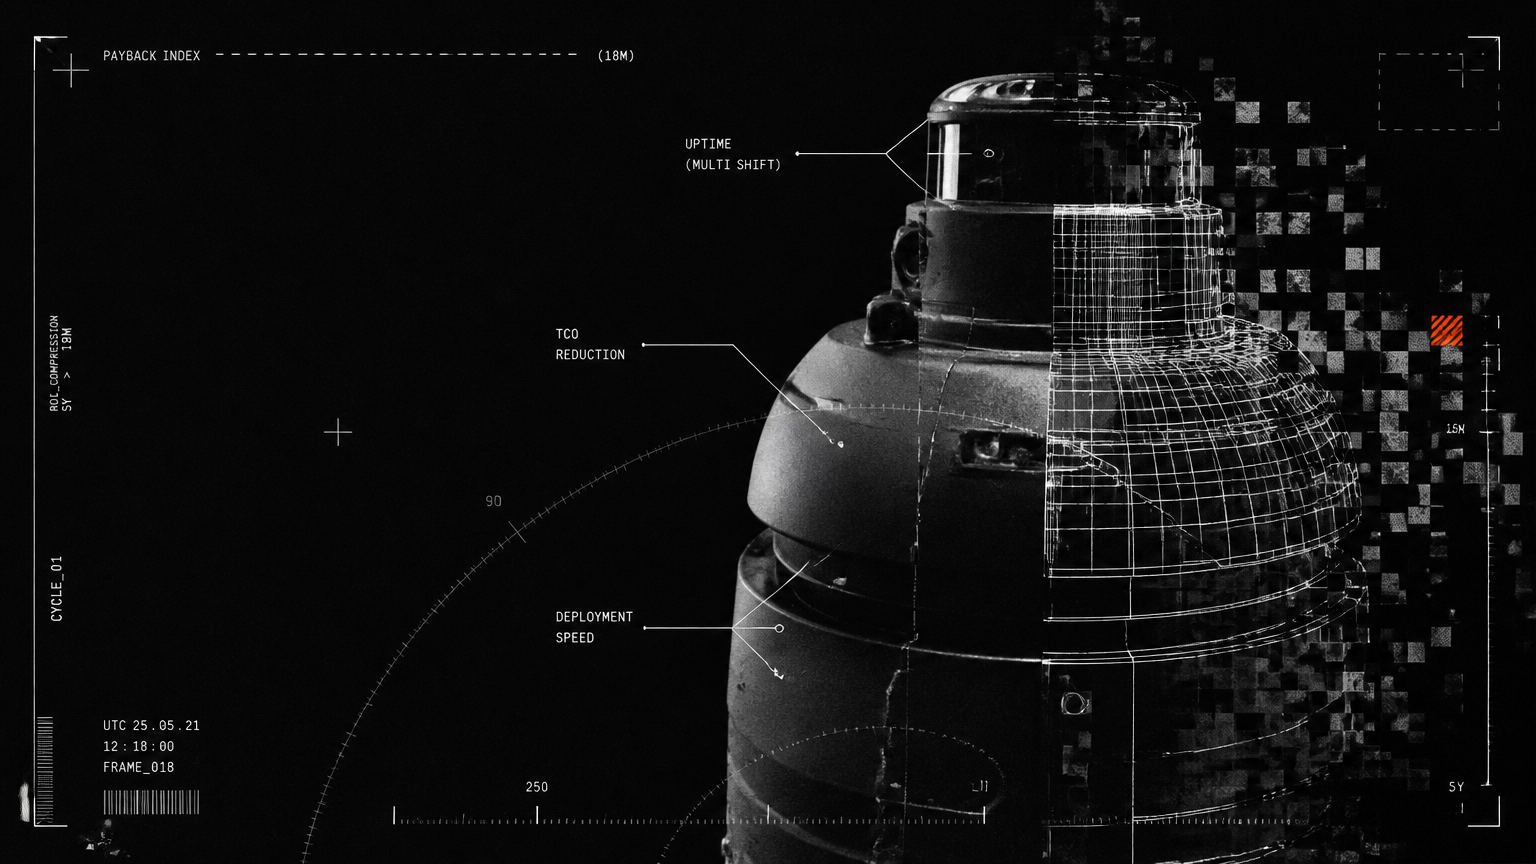
The average robot payback time dropped from ~5.3 years in 2019 to ~1.3 years in 2024, with well-run deployments now reporting 10:1 to 30:1 returns within 18 months. That shift was not driven by one breakthrough, but by three economic forces moving together.
1. Automation costs fell while capability rose
Early service and industrial robots were expensive, single-task, and integration-heavy. Hardware prices, sensors, navigation and deployment tooling have matured significantly. Made-in-India manufacturing and in-house engineering have further reduced total cost of ownership versus assembled-from-parts systems.
Allbotix, for example, engineers its fleet in-house with full IP ownership of design, firmware and source code, and scales manufacturing via its Aimtron Technologies partnership. That precision engineering approach — building machines engineered to a client's specific precision, ambition and scale — lowers lifetime cost compared to retrofitting generic off-the-shelf units for Indian facility conditions, foot-traffic density and multi-shift duty cycles.
2. Labor, turnover and downtime costs rose
While automation got cheaper, the costs robots offset got more expensive:
Manufacturing faces a projected shortfall of 2M+ workers over the next decade, according to Deloitte and the Manufacturing Institute. In services, front-desk coverage, cleaning, serving and material handling suffer from high turnover, re-hiring and training costs, overtime for peak hours, and inconsistent coverage across shifts and sites.
Unplanned downtime compounds the math. Automation paired with condition-based monitoring has been shown to cut unplanned downtime 30-50%, with documented cases showing 26%+ reductions and ~$630K in annual savings per plant. When a robot prevents even a few hours of line stoppage, lobby bottleneck or cleaning backlog per month, the robot payback period shortens dramatically.
3. Utilization went from single-shift to multi-shift with software-driven uptime
The biggest change is utilization. A robot that works one shift, five days a week with frequent manual intervention cannot pay back quickly. A robot that runs two to three shifts, seven days a week, with 99.8% uptime and predictive maintenance can.
Modern fleets combine autonomous navigation, real-time monitoring and predictive maintenance through proprietary AI fleet-management software. Instead of discovering a fault after a missed cleaning cycle or failed delivery, operations teams see battery, navigation and component health in real time and intervene before downtime occurs. That is how throughput increases of 15-30% and capacity uplifts of 20-40% become bankable in an ROI model.
| Payback Driver | 2019-Era Deployment | 2026 Fleet Deployment |
|---|---|---|
| Hardware model | High-cost, single-task, assembled parts | Lower-cost, multi-task, in-house engineered platforms |
| Deployment scope | Single pilot unit, limited hours | Multi-unit fleet across shifts and sites |
| Uptime model | Reactive maintenance, manual supervision | AI fleet management + predictive maintenance, 99.8% uptime benchmark |
| Labor offset | Partial single-shift assistance | Multi-shift coverage for reception, cleaning, serving, AMRs |
| Payback outcome | ~5.3 years average | 12-18 months for high-frequency use cases |
Where a 12- to 18-Month Robot Payback Period Happens Fastest
Not every task pays back equally. The fastest service robot ROI comes from high-frequency, labor-intensive, measurable workflows where robots run daily across peak and off-peak hours. Four categories consistently lead:
| Comparison Criterion | Front-Desk and Visitor Management | Facility Cleaning | Serving and Delivery | AMR Material Movement |
|---|---|---|---|---|
| Best-fit verticals | Corporate, government, education, healthcare, airports | Corporate, retail, healthcare, education, transit hubs | Hospitality, healthcare, corporate pantries | Manufacturing, logistics, healthcare, large campuses |
| High-frequency task | Check-ins, wayfinding, FAQs, registrations | Floor scrubbing, vacuuming, large-area upkeep | Food, beverage, linen, pharmacy and pantry runs | Pallet, bin, parts and inventory transport |
| Primary cost offset | Front-desk staffing, overtime, visitor wait time | Contract cleaning hours, rework, consumable waste | Runner staff, peak-time gaps, delivery delays | Forklift trips, manual trolley labor, line idle time |
| ROI accelerator | 24/7 greeting with consistent data capture | Multi-shift autonomous coverage with consistent quality | Peak-hour throughput without added headcount | Continuous flow with fleet visibility |
Front-desk and visitor management
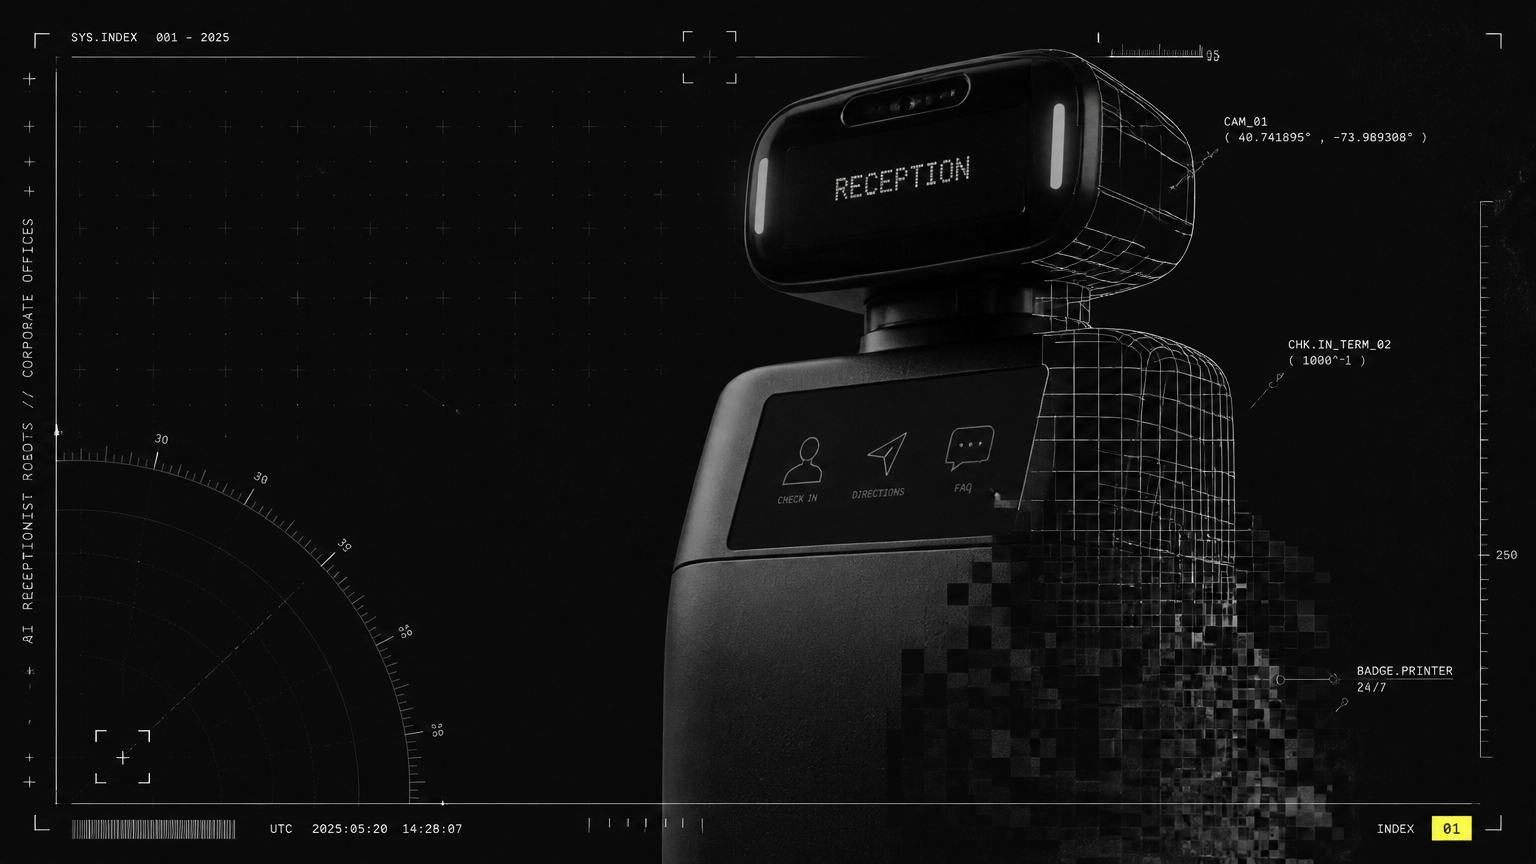
Corporate IT parks, government offices, universities, hospitals and airports process hundreds to thousands of visitors daily. AI receptionist robots handle check-in, visitor badges, directions, multilingual FAQs and meeting notifications without breaks, while logging every interaction for transparency and audit.
Payback comes from reduced front-desk staffing load, fewer overtime shifts for events and peak hours, shorter queues and better visitor data. For facilities with dense foot traffic and recurring reception costs, this is often the fastest path to positive robotics ROI because utilization is continuous during operating hours.
Facility cleaning and cleaning robot cost savings
Cleaning robot cost savings are among the easiest to quantify for finance teams. Large-format retail, office parks, hospitals, universities and transit hubs pay for nightly and daytime cleaning across lakhs of square feet. Autonomous floor-cleaning robots run scheduled multi-shift routes with consistent pathing, water and chemical use, and coverage reporting.
Savings accrue from fewer contract hours for repetitive floor work, less rework, lower consumable waste and auditable coverage logs. Because cleaning is daily, high-area and shift-repeatable, even a single robot covering 2-3 shifts can offset significant recurring cost within months, not years.
Serving and delivery
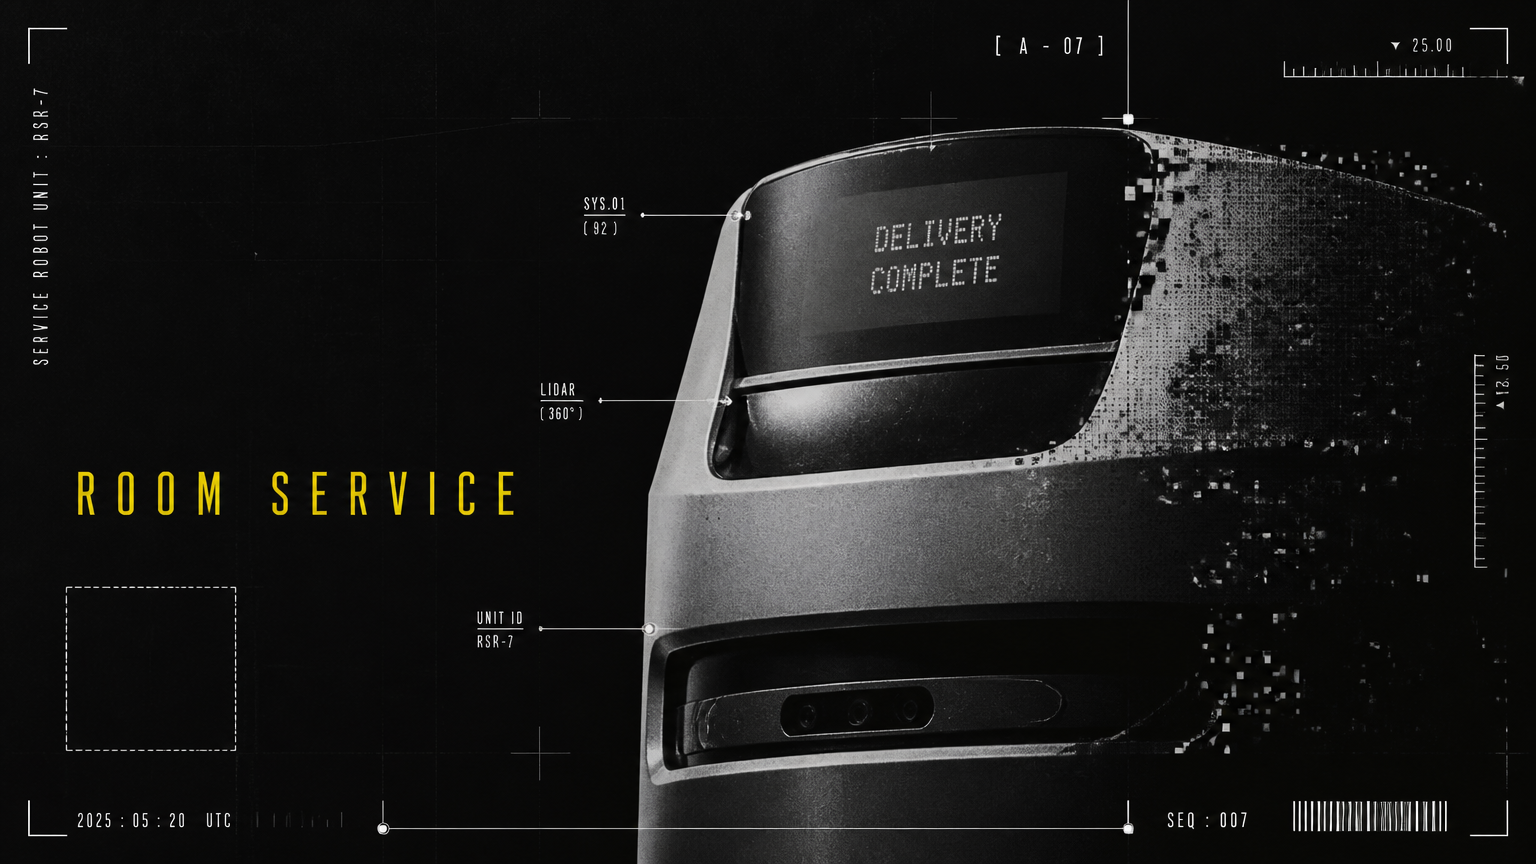
Hotels, restaurants, event spaces, hospitals and corporate pantries face peak-time service gaps: lunch rushes, banquet surges, night-shift pantry runs and nurse-station deliveries. Serving and delivery robots shuttle food, beverages, linens and small goods on fixed indoor routes, freeing staff for guest interaction and clinical care.
Here service robot ROI is driven by throughput during peaks, reduced runner headcount, fewer delivery delays and more consistent service quality. Hospitality and healthcare leaders typically model payback on meals or trays delivered per day, reduced wait times and avoided agency or overtime staffing.
Autonomous mobile robot ROI in material movement
Autonomous mobile robot ROI is strongest where material moves constantly: plants, warehouses, 3PL fulfillment centers and large hospital or campus logistics. AMRs transport bins, parts, pallets and linens point-to-point with fleet coordination, traffic management and real-time visibility.
Value comes from replacing repetitive forklift and trolley trips, reducing line idle time, improving inventory flow and gaining fleet-level tracking. With 15-30% throughput gains documented in industrial automation studies, AMR fleets tied to production takt or order waves often achieve a cobot payback period-style timeline of 12-18 months when utilization exceeds two shifts.
Allbotix spans all four categories — AI receptionists, cleaning, serving, AMRs, plus cobots, humanoids and quadrupeds — under one fleet-management layer, which matters for multi-site operators that want reception, cleaning and logistics robots orchestrated together rather than as disconnected pilots.
How to Calculate Your Robot Payback Period: A Practical Framework
A credible robot ROI calculator does not need to be complex, but it must be complete. Finance teams should model fully loaded costs on both sides: what the robot costs over 3-5 years versus what it offsets and enables.
Simple payback formula:
Payback (months) = (Total upfront + deployment cost) / (Average net monthly benefit - monthly run cost) x 12
Total cost should include hardware or RaaS fees, deployment and integration, training, spares and annual support. Monthly benefit should include:
- Fully loaded labor offset: wages, overtime, agency staff, benefits and hiring/training cost for turnover-prone roles
- Throughput and uptime gain: extra covers served, faster visitor processing, reduced line idle time, 20-40% capacity uplift where applicable
- Quality and consistency: 20-50% scrap or rework reduction in QC-linked tasks, fewer service failures and penalties
- Maintenance efficiency: reduced contract cleaning hours, optimized consumables, and avoided unplanned downtime
Monthly run cost should include power and charging, consumables, connectivity, fleet-software licenses and 24/7 support.
For example, if a facility spends Rs. 90,000 per month per shift on contract cleaning and supervision for a zone, and one cleaning robot reliably covers two shifts with Rs. 18,000 in monthly run and amortized support costs, the net monthly benefit exceeds Rs. 1,50,000 before counting consistency and audit value. That is how 18-month payback becomes conservative rather than optimistic.
The key is to base service robot ROI, autonomous mobile robot ROI and cobot payback period estimates on measured baselines — visitors per day, sq. ft. cleaned per shift, trays moved per hour, AMR trips per shift — not vendor assumptions. Allbotix deployments pair hardware with real-time monitoring and reporting precisely so operations leaders can validate these inputs after go-live and expand from pilot zones to full floors and buildings with data.
How to Lock In Faster Robotics ROI: From Pilot to Scaled Fleet
Robots that pay back in 18 months are rarely lucky pilots. They are engineered deployments with three disciplines:
1. Pick high-frequency, high-pain tasks first Start where work repeats daily across shifts: lobby check-ins, floor scrubbing, pantry runs, bin transfers. Avoid low-volume novelty use cases for ROI justification. Map staffing cost, foot-traffic peaks and maintenance backlogs by hour and zone, then assign robots to the densest blocks.
2. Orchestrate fleets with AI management, not manual supervision Uptime is ROI. Proprietary AI fleet management with real-time monitoring and predictive maintenance keeps multiple form factors — receptionist, cleaning, serving, AMR — coordinated on routes, charging and tasks. With 525+ robots developed, 180+ happy clients and 99.8% uptime as an operating benchmark, Allbotix treats software-driven uptime as core infrastructure, backed by 24/7 Premium Support, not an add-on.
3. Choose engineered-for-scale fleets over off-the-shelf pilots
| Criterion | Off-the-Shelf Pilot | Engineered-for-Scale Fleet |
|---|---|---|
| Engineering | Assembled parts, generic navigation | In-house design, firmware and IP, tuned to site layout and duty cycle |
| Portfolio breadth | Single-category device | Receptionist, cleaning, serving, AMR, cobot, humanoid and quadruped under one platform |
| Software layer | Basic app or manual control | Proprietary AI fleet management with real-time monitoring and predictive maintenance |
| Support model | Limited warranty, third-party service | 24/7 Premium Support with lifecycle maintenance |
| Scale path | Re-pilot for each new site | Replicate maps, workflows and reporting across buildings and cities |
| Credibility signal | Startup hardware risk | Backed by publicly listed Nanta Tech Limited, Made-in-India with Aimtron scale |
This distinction embodies Allbotix's limitless innovation and precision engineering ethos: machines built for a client's ambition and scale, with full IP ownership, rather than retrofitted imports that stall after the demo.
For corporate, government, retail, education, healthcare, hospitality, manufacturing, logistics and transit leaders, the implication is clear. Model the robot payback period on your highest-frequency staffing and maintenance costs, demand multi-shift uptime with transparent reporting, and plan the second and third sites before you approve the first.
Talk to Allbotix to estimate your 18-month robotics ROI. Share your front-desk volumes, cleaning area and shifts, serving peaks or AMR trip data, and Allbotix will map the right fleet mix — reception, cleaning, serving, AMR or cobot — with deployment, fleet software and 24/7 support engineered for payback. Visit https://www.allbotix.ai/ to start your assessment.