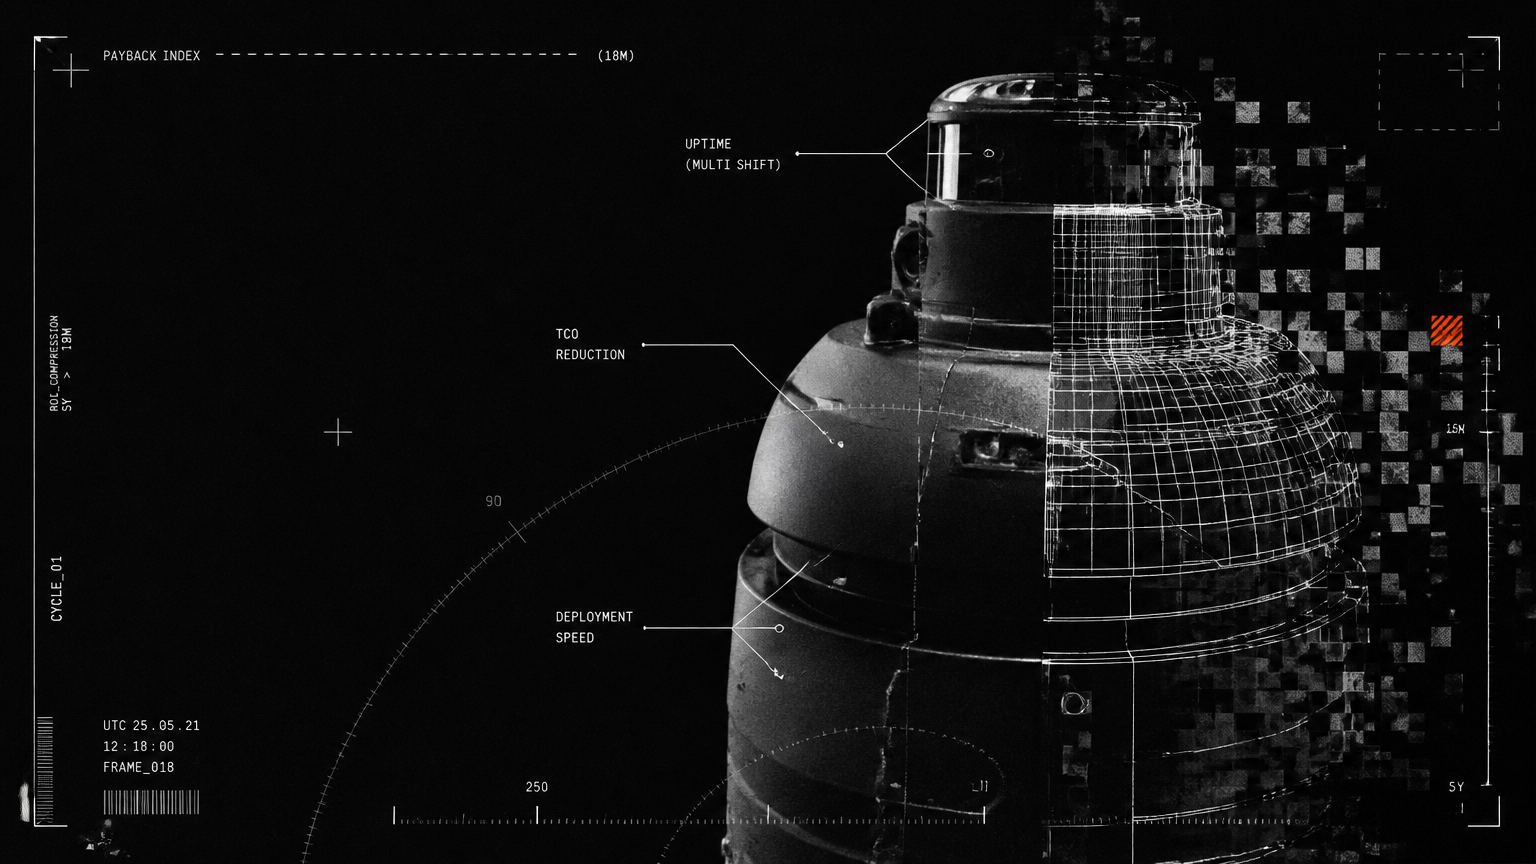
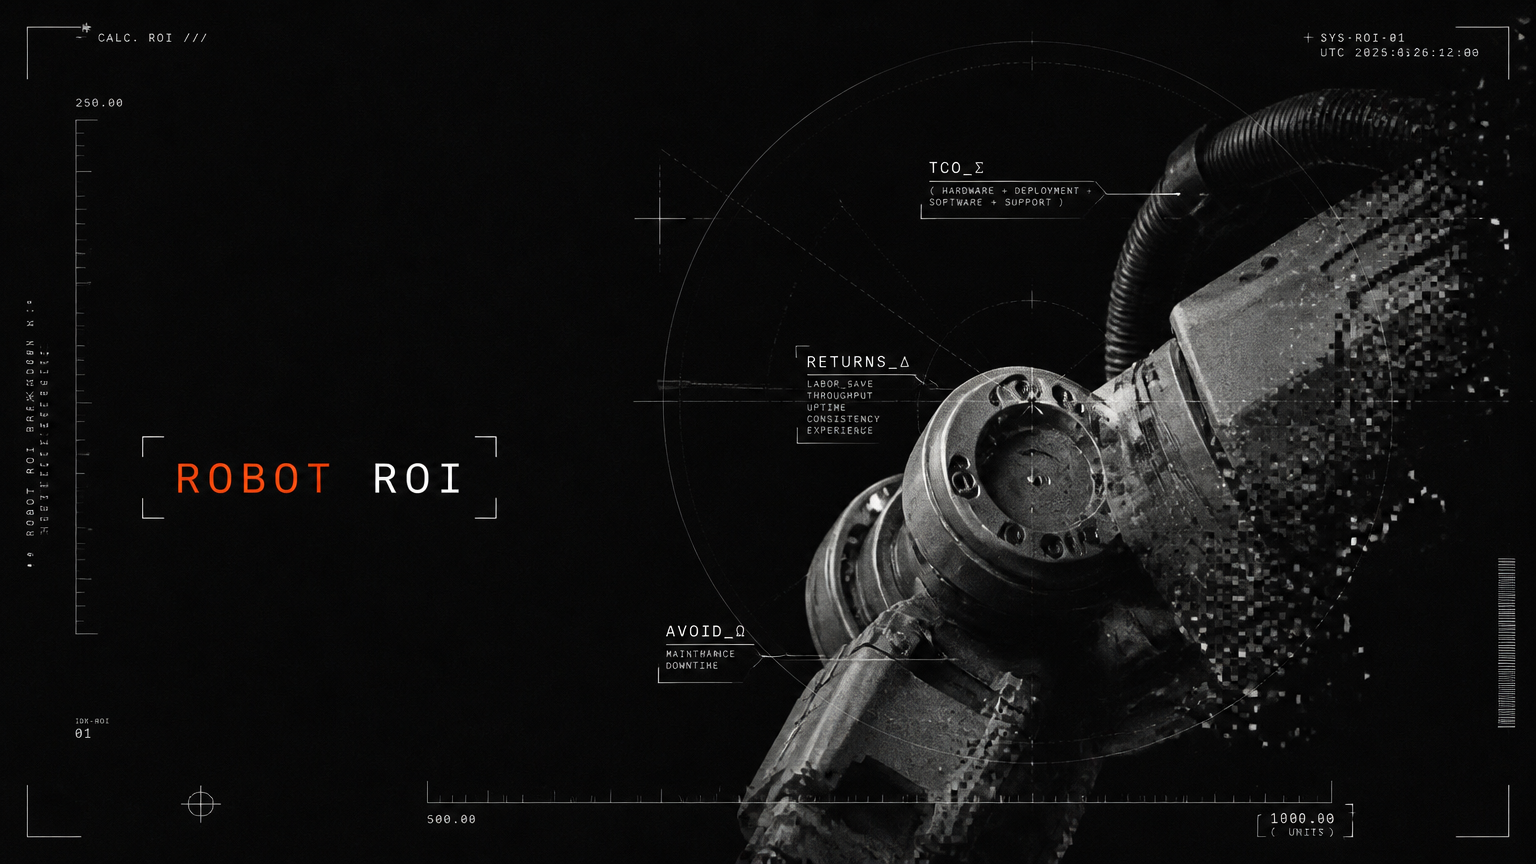
We calculate robot ROI by comparing full total cost of ownership — hardware, deployment, fleet-management software, and 24/7 support — against measurable returns from labor savings, throughput gains, uptime, and service consistency. Unlike labor-only math, our transparent breakdown includes productivity, maintenance avoidance, and customer experience value across receptionist, cleaning, serving, AMR, cobot and humanoid deployments.
For operations, facilities and finance leaders evaluating automation, learning how to calculate robot ROI correctly is the difference between a pilot that stalls and a deployment that scales. This guide explains the exact formula Allbotix uses, what costs we include, what savings count, and how payback varies across corporate campuses, government, retail, education, healthcare, hospitality, manufacturing, logistics and transit hubs.
The Transparent robot ROI Formula: How to Calculate Robot ROI Correctly
At its simplest, a robotics ROI calculator answers two questions: What did you invest in total, and what did you get back in total?
We use two standard metrics:
1. ROI Percentage: ROI % = [(Total Annual Gains - Total Annual Cost of Ownership) / Total Annual Cost of Ownership] x 100
2. Payback Period: Payback (months) = Total Initial Investment / Average Monthly Net Benefit
Where Monthly Net Benefit = Monthly Gains (labor redeployed + throughput value + downtime avoided + quality value) minus Monthly Ongoing Costs (software, support, consumables, energy).
This approach reflects precision engineering, not guesswork. If a vendor only compares a robot's price to one salary, you are not seeing payback — you are seeing a partial cost comparison.
What We Include in Total Cost of Ownership
Transparency starts with full costs. Our total cost of ownership model includes four layers:
1. Hardware engineered for your use case: Allbotix machines are engineered to a client's specific precision, ambition and scale, not assembled from off-the-shelf parts. With full IP ownership of design, firmware, source code and trademarks, plus Made-in-India manufacturing scaled via our Aimtron Technologies partnership, we control quality and lifecycle cost from day one.
2. Deployment and integration: Site mapping, workflow design, safety configuration, Wi-Fi and elevator/access integration, and staff training. For AMRs in logistics or cleaning robots in hospitals and airports, this ensures the robot fits existing SOPs instead of disrupting them.
3. Proprietary AI fleet-management software: Every deployment is paired with our proprietary AI fleet management platform with real-time monitoring and predictive maintenance. This is not an add-on license — it is central to how we sustain 99.8% uptime across 525+ robots developed and 180+ happy clients.
4. 24/7 Premium Support: Remote diagnostics, preventive maintenance schedules, spare parts and on-ground assistance. Support cost is part of ROI math because uptime is part of ROI returns.
What We Count as Returns
Measurable service robot ROI comes from four return categories:
1. Labor savings and redeployment: Hours of repetitive work automated — front-desk coverage, floor scrubbing, food running, pallet movement — redeployed to higher-value tasks. We calculate this on fully-loaded cost (salary + benefits + overtime + turnover hiring cost), not base salary.
2. Throughput and capacity gains: More covers served per hour, more square feet cleaned per shift, more picks moved per day. In manufacturing, well-designed automation typically delivers 15–30% throughput increases and 20–40% capacity uplift by closing persistent workforce gaps.
3. Uptime and maintenance avoidance: Automation with condition-based monitoring can cut unplanned downtime by 30–50%. We model avoided downtime, avoided deep-cleaning or rework costs, and extended asset life from consistent operation.
4. Consistency and experience value: Fewer service errors, consistent cleaning quality for infection control, shorter wait times, and 24/7 availability. For retail, hospitality and corporate campuses, this drives retention, ratings and brand differentiation.
Why Labor-Only Math Underestimates Service Robot ROI
Most buyers are shown a simple equation: robot cost vs. one employee salary. That understates both costs and returns, and it penalizes high-uptime fleets.
| Criterion | Labor-Only Calculation | Allbotix Transparent robot ROI Model |
|---|---|---|
| Cost scope | Hardware price only | Hardware + deployment + fleet-management software + 24/7 Premium Support |
| Labor value | Base salary of 1 FTE | Fully-loaded cost, overtime, turnover, multi-shift coverage |
| Productivity | Assumes 1:1 human replacement | Measures throughput, sq. ft./hour, deliveries/hour, missions/day |
| Uptime | Assumes 100% availability | Modeled on 99.8% uptime with predictive maintenance data |
| Quality | Ignored | Includes scrap/rework reduction of 20-50%, consistency, compliance logs |
| Payback view | Static 12-month snapshot | TCO vs. 3-year gains, payback period + 18-month ROI multiple |
Industry data shows why this matters. Average robot payback time has dropped from ~5.3 years in 2019 to ~1.3 years in 2024, with well-run deployments seeing 10:1 to 30:1 returns within 18 months. You only capture that full return if you measure throughput and uptime, not just headcount.
Vertical Breakdown: Where robot ROI Comes From by Deployment
Different environments create payback in different ways. Here is how we model returns across our multi-vertical fleet spanning receptionist, humanoid, dog, cleaning, serving, AMR, and cobot form factors.
| Deployment | Primary Cost Offset | Throughput and Uptime Gain | Consistency and Experience Value |
|---|---|---|---|
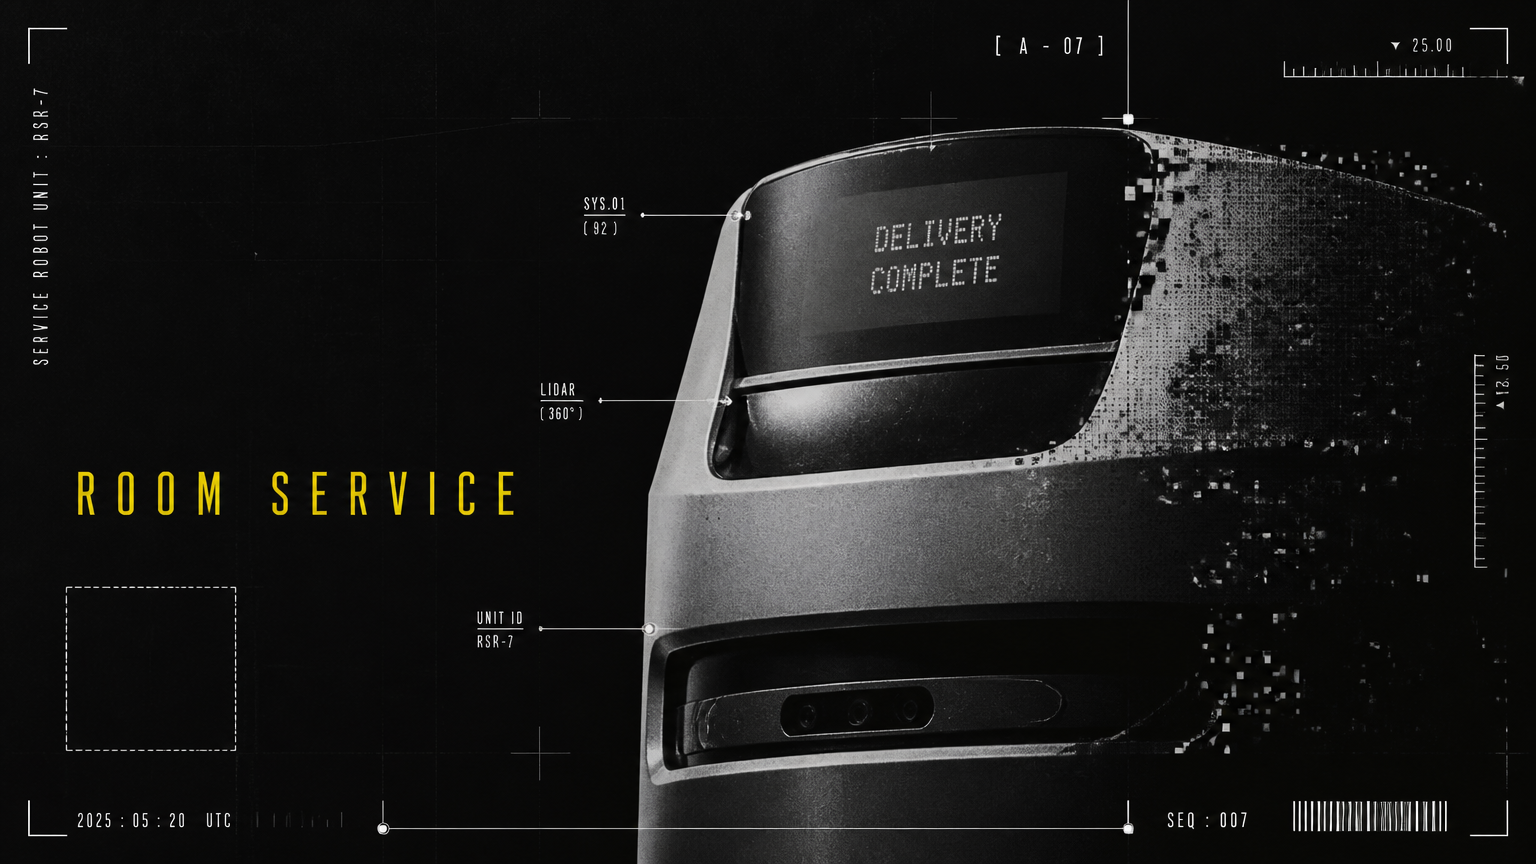
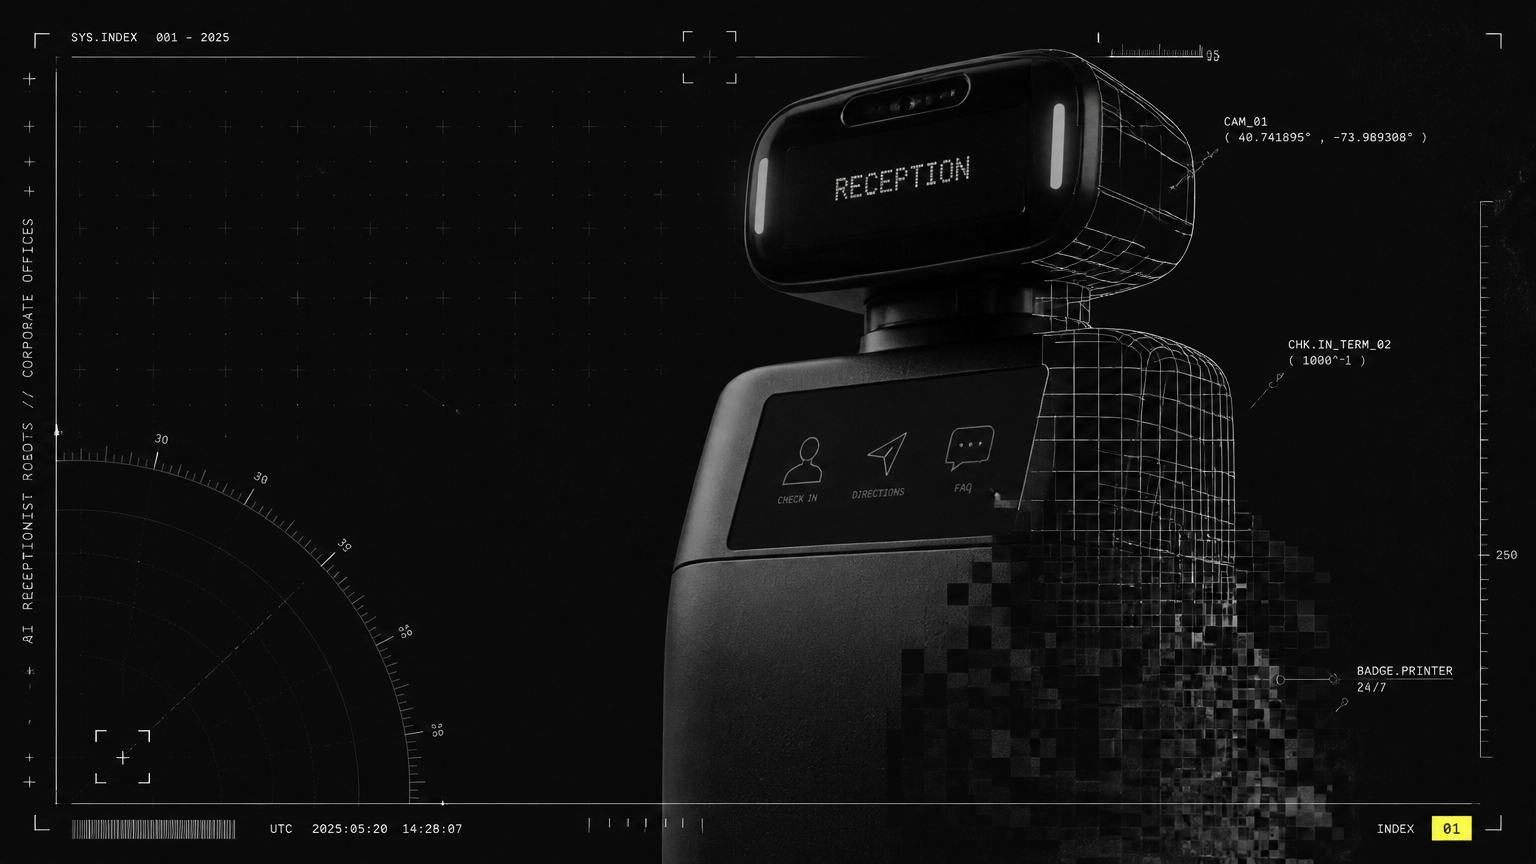
| AI Receptionist Robots for Corporate, Government, Education | Front-desk staffing cost across shifts, visitor log labor | 24/7 check-in, 1000+ daily interactions, multilingual support | Shorter queues, audit-ready visitor data, brand impact |
| Cleaning Robots for Healthcare, Airports, Retail, Corporate | Contract cleaning hours, overtime, consumable waste | 3x-5x sq. ft. per hour vs. manual, night-shift autonomy | Infection control consistency, ATP-verified logs, slip-risk reduction |
| Serving Robots for Restaurants, Hotels, Events | Runner and food-expediter hours, peak-time overtime | 20-40% more table turns, 300+ dishes per day per unit | Hot-food delivery time, fewer spills, guest novelty and ratings |
| AMRs for Logistics, Manufacturing, Hospitals | Material handlers, forklift trips, linen/pharmacy runs | Continuous pallet and tote flow, fleet visibility, 24/7 missions | Fewer collisions, traceable deliveries, reduced product damage |
| Cobots and Humanoids for Manufacturing and Training | Repetitive assembly, machine tending, training labor | 15-30% line throughput lift, standardized training delivery | 20-50% scrap reduction, safer ergonomics, SOP compliance |
Receptionist ROI: Corporate, Government and Education
For IT/tech campuses, co-working spaces, office parks, universities and public-service centers, front-desk staffing cost and dense foot traffic drive ROI. An AI receptionist robot handles check-ins, directions, meeting-room guidance and FAQs without breaks, while your team focuses on exceptions and hospitality.
We calculate how to calculate robot ROI here as: multi-shift coverage value + reduced temp staffing + visitor throughput per hour. For government clients with tight staffing budgets, public-service transparency matters too — digital logs provide an audit trail that manual registers cannot.
Cleaning Robot ROI: Healthcare, Airports, Retail and Transit Hubs
Cleaning robot ROI is driven by area performance and shift coverage. Hospitals, clinics, malls, large-format stores and airports need round-the-clock strain coverage with verifiable hygiene.
Our model measures: square feet cleaned per autonomous hour, reduction in contract hours and overtime, water/chemical savings from precision dispensing, and avoided re-cleaning. For healthcare, infection-control consistency and night-time autonomous cleaning without disrupting care are often worth more than direct labor savings alone.
Restaurant Serving Robot ROI: Hospitality and Retail Foodservice
Restaurant serving robot ROI comes from peak-time service gaps. Hotels, restaurants, resorts and event spaces struggle with inconsistent service quality and labor-intensive workflows during rush hours.
A serving robot runs food, bussing and pantry delivery continuously, allowing 2-3 fewer runners per shift to be redeployed as upselling servers. We model dishes delivered per hour, table-turn improvement, breakage reduction, and guest satisfaction lift. In high-turnover retail food courts, reduced hiring and training cost accelerates payback further.
AMR ROI Calculation: Logistics, Manufacturing and Healthcare Transport
AMR ROI calculation is the most throughput-sensitive. For 3PL, fulfillment, distribution centers, industrial parks and hospital logistics, value comes from inventory movement and fleet visibility.
We track: missions completed per day, distance traveled autonomously, wait-time reduction at pick stations, and avoided forklift incidents. Paired with our AI fleet management software, AMRs are dynamically rerouted, battery-optimized and predictively maintained — which is why fleet uptime, not single-robot speed, determines payback.
Cobot and Humanoid ROI: Manufacturing Productivity and Consistency
For manufacturing and production, cobots address production inefficiency, workforce shortage and costly downtime. Humanoids add value in factory training and assistance, delivering consistent demonstrations across shifts and plants.
Returns include direct cycle-time reduction, scrap-rate reduction from automated QC, and avoided unplanned downtime. Documented cases show 26%+ downtime reductions translating to ~$630K in annual savings per plant — savings that belong in any serious ROI model.
How Allbotix Protects Your robot ROI After Deployment
Payback is not decided on purchase day. It is protected every day the fleet runs. That is where limitless innovation backed by in-house engineering matters.
In-house engineering with full IP ownership: Unlike assemblers, Allbotix owns design, firmware, source code and trademarks. With 525+ robots developed, we can adapt navigation, payloads, brushes, trays or grippers to your facility and update behavior over time without third-party delays. Machines engineered to your scale hold value longer and integrate faster.
Proprietary AI fleet management with predictive maintenance: Our software layer provides real-time monitoring, mission analytics and predictive maintenance alerts across receptionist, cleaning, serving, AMR, cobot and humanoid fleets. Instead of reacting to failures, we prevent them — a core reason we sustain 99.8% uptime. For finance leaders, uptime is compounding ROI: every avoided hour of downtime preserves labor savings and throughput gains.
24/7 Premium Support: Robots working night shifts in hospitals, warehouses and airports need support at 2 a.m., not 10 a.m. Our 24/7 Premium Support combines remote diagnostics with preventive service, protecting the availability assumptions in your business case.
Credibility that de-risks capex: Allbotix is backed by publicly listed Nanta Tech Limited, with Made-in-India manufacturing scaled through Aimtron Technologies. For corporate, government and enterprise buyers, that means auditable governance, local spares and service depth, and a roadmap beyond a single pilot — critical when you are approving multi-site rollouts.
This breadth — one partner across service and industrial needs — also compounds returns. A corporate campus can start with AI receptionists and floor-cleaning automation, then add pantry delivery robots on the same fleet-management platform. A hospital can combine cleaning automation with AMR-based pharmacy transport. One dashboard, one support contract, multiple payback streams.
How to Model Payback Before You Approve: A Simple Walkthrough
You do not need complex software to run an initial robotics ROI calculator check. Use this transparent sequence we follow in discovery:
Step 1: Baseline your current cost. Document fully-loaded hourly cost x hours per day x days per year for the task. Include overtime, agency fees and turnover. Example: two-shift front-desk coverage or nightly floor scrubbing across 100,000 sq. ft.
Step 2: Define robot throughput. Set a conservative missions-per-day or area-per-hour target with your Allbotix engineer based on site mapping — not brochure top speed.
Step 3: Add consistency value. Estimate avoided rework, downtime or lost covers. Even a 10% improvement in table turns or a 20% cut in unplanned transport delays often exceeds direct labor savings.
Step 4: Subtract full TCO. Include hardware, deployment, software and 24/7 support amortized annually, plus energy and consumables.
Step 5: Calculate payback and 3-year ROI. Most service and AMR deployments we see model payback in 12-18 months when multi-shift operation and uptime are included, with manufacturing cells varying by cycle time and scrap reduction.
The key is to demand the same transparency from every vendor: ask for TCO in writing, uptime commitments backed by fleet data, and vertical references — not just a price and a salary comparison.
Transparent robot ROI is not about proving robots are cheap. It is about proving they are productive, available and consistent long after installation.
If you are evaluating receptionist, cleaning, serving, AMR, cobot or humanoid automation for corporate, retail, healthcare, hospitality, manufacturing, logistics, education, government or transit operations, talk to Allbotix for a site-specific ROI assessment. We will map your workflows, model full total cost of ownership against labor, throughput and uptime gains, and design a deployment engineered to pay back — and keep paying back. Visit https://www.allbotix.ai/ to start your transparent ROI calculation with our engineering team.