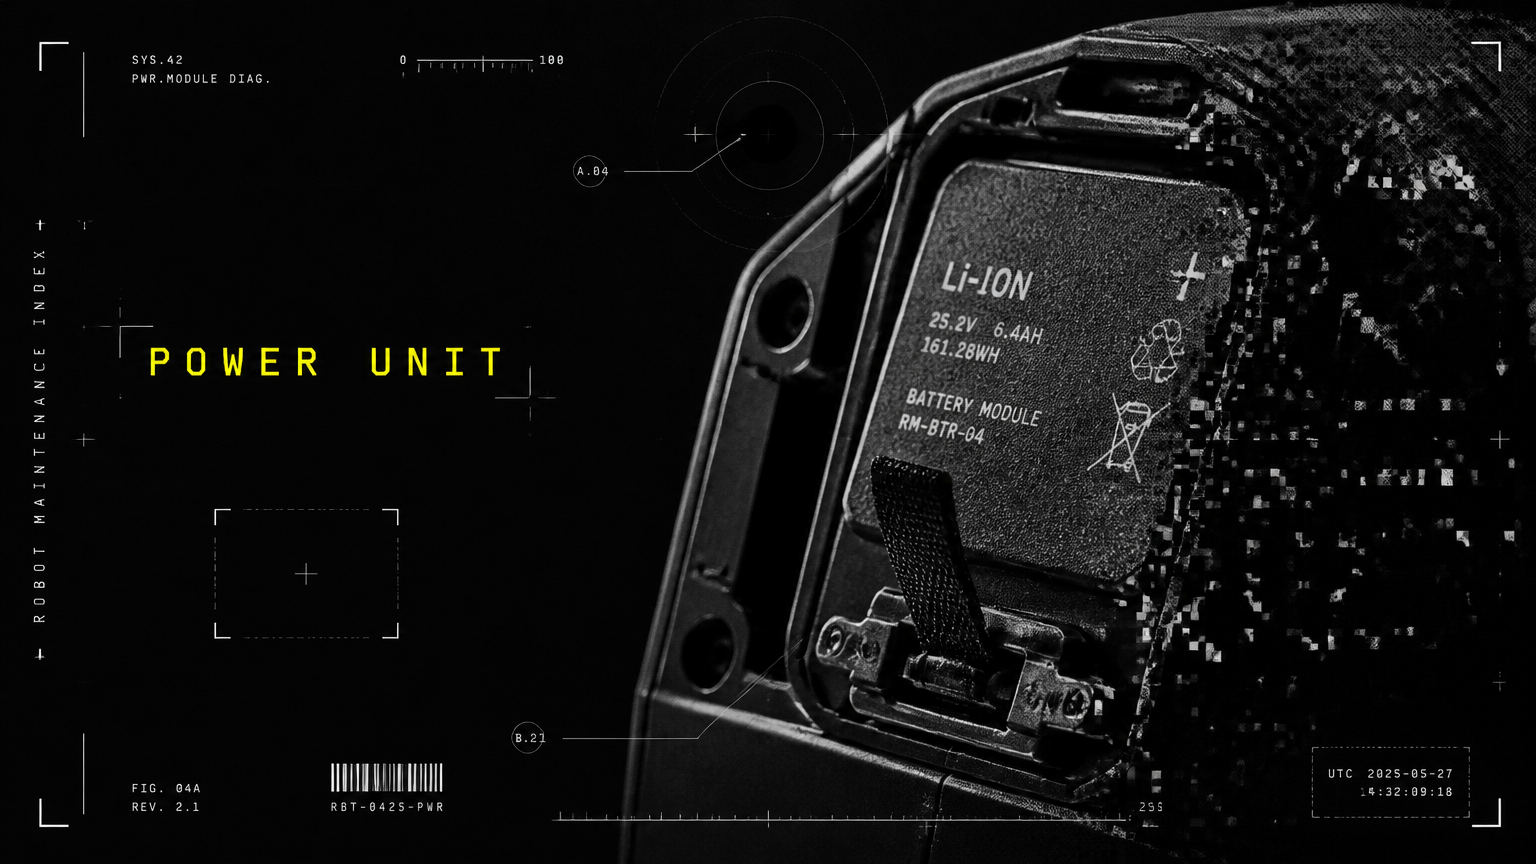
Quick answer — Robot battery replacement cost depends on battery chemistry, capacity, robot form factor and duty cycle — costs are driven by cell type (Li‑ion vs alternatives), capacity (Ah/Wh), integration complexity and disposal/recycling requirements. Battery life is measured in charge cycles and calendar years and degrades with use, temperature and charging patterns; proactive fleet-management and predictive-maintenance strategies can extend life and reduce replacement-related downtime and TCO.
Part of our guide to Maintenance, Support & Lifecycle: What's Inside a Robot AMC? Service Contracts, SLAs and Response Times.
If you’re budgeting for robot battery replacement cost, this guide gives clear, practical estimates and explains why batteries fail, how to detect degradation early, and which fleet strategies (spare pools, hot-swap packs, predictive replacement and recycling) minimize downtime and total cost across multi-robot deployments.
robot battery replacement cost: Key cost drivers and total cost of ownership
Understanding what determines robot battery replacement cost helps you budget and evaluate procurement models. The main cost drivers are:
- Battery chemistry and cell cost per Wh
- Nominal capacity (Wh) required to meet runtime
- Mechanical/electrical integration effort (custom housings, BMS)
- Labour and field-service visit costs for replacement
- Disposal, recycling, and regulatory compliance fees
- Downtime cost (lost throughput, manual labor backfill)
- Warranties, service contracts and spare-part inventory carrying costs
Below is a concise comparison of common battery chemistries used in robotics.
| Criterion | Lithium‑Ion (NMC / NCA) | LiFePO4 (LFP) | Lead‑Acid (VRLA/Flooded) |
|---|---|---|---|
| Energy density (Wh/kg) | High (150–250) | Moderate (90–140) | Low (30–50) |
| Typical cycle life | 800–3,000 cycles | 2,000–5,000 cycles | 200–1,000 cycles |
| Cost per Wh (approx.) | Moderate–High | Moderate | Low |
| Thermal stability & safety | Good, needs BMS | Very good, thermally stable | Poorer; heavier, heat sensitivity |
| Disposal/recycling complexity | Well-established, regulated | Easier recycling, fewer thermal risks | Widely recycled but bulkier |
| Typical use cases in robots | AMRs, cobots, higher energy density needs | Long-life AMRs, stationary backup, heavy-duty use | Low-cost demo robots, legacy systems |
Cost per replacement scales with Wh capacity and integration complexity. Example illustrative USD replacement ranges by robot class (prices are approximate — final quotes depend on pack specs and integration):
| Robot class | Typical battery size (Wh) | Replacement cost (USD, approx.) |
|---|---|---|
| Small service robots (receptionists, waiters) | 100–500 Wh | $200–$800 |
| Floor-cleaning robots, medium AMRs | 500–2,000 Wh | $500–$3,000 |
| Large AMRs, industrial mobile bases | 2,000–8,000 Wh | $1,000–$6,000+ |
| Cobots / Humanoids (integrated packs) | 1,000–10,000 Wh | $1,500–$10,000+ |
Budgeting guidance:
- For multi-robot fleets, plan battery replacement as a predictable annual/biannual line item based on cycle life and duty cycle rather than ad-hoc emergency spend.
- Include labour and travel in field replacements: onsite swaps can add several hundred dollars per visit.
- Factor end‑of‑life disposal/recycling costs (or include vendor take-back in purchase price).
robot battery replacement cost: Procurement models and inventory strategies
Choosing the right procurement model can materially change your effective replacement cost and downtime exposure. The table below compares common fleet strategies.
| Criterion | Spare inventory | Swap‑pool (hot‑swap packs) | Service contract / OEM replacement | Scheduled wholesale replacement |
|---|---|---|---|---|
| Up‑front capital | Moderate–High (buy spares) | High (multiple packs per robot) | Low (pay-as-you-go) | Medium (bulk ordering) |
| Downtime on failure | Low (immediate swap) | Very low (instant hot-swap) | Medium (service SLAs) | High (wait until scheduled) |
| Inventory management complexity | Medium | High | Low | Medium |
| Predictability of costs | Moderate | Higher (capex) | High (OPEX, predictable fees) | High |
| Best for | Small fleets with spare storage | High‑utilization fleets | Risk-averse ops teams | Cost-sensitive, low-urgency sites |
Practical recommendation:
- For high-density deployments (airports, logistics hubs), invest in swap‑pool architectures and hot‑swap racks to eliminate downtime.
- For distributed, low-density sites (satellite offices, small retail outlets), service contracts with fast SLAs and a minimal spare kit are often more cost-efficient.
Lifespan, degradation mechanics and diagnostics
Battery life is governed by two related concepts:
- Charge‑cycle life: number of full cycles until capacity falls below a threshold (commonly 70–80% of original).
- Calendar life: aging over time even without heavy use, driven by chemistry and storage conditions.
Primary factors accelerating degradation:
- Depth of Discharge (DoD): deeper discharges shorten cycle life. Operating at 20–80% SoC versus 0–100% effectively increases usable cycle life.
- High charge/discharge rates (C‑rate): fast charging raises internal temperature and accelerates degradation.
- Temperature: high temperatures accelerate chemical breakdown; cold reduces immediate capacity and increases internal resistance.
- State‑of‑Charge (SoC) extremes: storing at very high SoC for long periods can increase calendar aging.
- Poor cell balancing or faulty BMS: unbalanced cells or lack of thermal management result in uneven ageing and early pack failure.
Measurable KPIs to monitor (and typical replacement thresholds):
- Capacity retention (% of rated Wh): replace if < 70–80% of original when mission runtime is impacted.
- Internal resistance (mΩ): if resistance increases such that peak current delivery or runtime is reduced by >20%, consider replacement.
- Runtime under nominal load: if runtime drops below operational SLA (e.g., robot cannot complete a shift), schedule replacement.
- Charge acceptance (time to full): significantly longer charge times indicate degradation.
- SoH (State of Health) metric from BMS: vendor-specific, but falling SoH below 0.7–0.8 usually triggers action.
On-robot signs to watch for:
- Shorter runtime under normal tasks
- Longer or incomplete charging cycles
- Noticeable voltage sag under load (reduced performance)
- Increased thermal events (hot housings near BMS)
- Alerts from fleet-management software (cell imbalance, high internal resistance readings)
Allbotix’s proprietary fleet-management software ingests these telemetry streams in real time and applies predictive models so teams can replace batteries conditionally — before a failure causes unplanned downtime.
Replacement & fleet strategies to reduce downtime and TCO
Below is a direct comparison of common replacement strategies so you can choose based on fleet size, criticality, and budget.
| Criterion | Scheduled replacement | Condition‑based / Predictive replacement | Hot‑swap / Swappable packs | Warranty / OEM replacement plan |
|---|---|---|---|---|
| Downtime risk | Medium–High | Low | Very low | Low–Medium (SLA dependent) |
| Cost predictability | High | Medium (depends on predictions) | High (capex heavy) | High (predictable fees) |
| Spare inventory needed | Low | Low–Medium | High | Low |
| Complexity to implement | Low | High (requires telemetry + models) | Medium (mechanical design for swapping) | Low |
| Best for | Non-critical robots, simple fleets | Large fleets with telemetry (Allbotix use case) | 24/7 ops (airports, logistics) | Risk-averse buyers, small sites |
Actionable recommendations:
- For mission‑critical fleets (hospitals, airports, logistics) — combine hot‑swapable packs with predictive analytics to maintain continuous uptime.
- For multi-site, moderate‑size fleets (retail, corporate campuses) — use predictive replacement via fleet telematics and keep a small spare pool.
- For single-site or low‑utilization robots — scheduled replacement or a service contract with 24/7 support may be more cost-effective.
Allbotix combines hardware design expertise with in‑house predictive fleet management to support condition‑based replacement at scale. Our deployments have achieved industry-leading availability (99.8% uptime) across diverse verticals.
Practical steps to extend battery life and reduce replacement cost
Operational controls that materially extend battery life:
- Limit Depth of Discharge: configure robots to operate within a narrower SoC window (e.g., 20–80%) where feasible.
- Moderate charging rate: prefer slower or adaptive charging where operations allow.
- Temperature management: locate charging stations in temperature-controlled areas; implement thermal throttling.
- Avoid storing at 100% SoC for long periods: store batteries at ~40–60% for long idle periods.
- Implement cell balancing and a robust BMS: ensures uniform aging and prevents premature pack failure.
- Rotate and cycle spares: when using spare inventory, rotate packs to avoid calendar-aging imbalances.
Software practices:
- Use fleet telematics to track SoH, cycles, temperature, and DoD per unit.
- Trigger maintenance tickets automatically when SoH crosses thresholds.
- Use predictive models to forecast remaining useful life and schedule replacements during low-impact windows.
Allbotix’s fleet-management layer is built to implement these practices out of the box, helping clients across government, retail, healthcare, hospitality, manufacturing and logistics minimize downtime and replacement expenses.
Responsible disposal and recycling
End‑of‑life handling matters for compliance and cost control:
- Work with certified recyclers or battery manufacturers offering take‑back programs.
- Flatten packs per safety procedure and follow transport rules for lithium batteries — many regions require hazardous-material carriers.
- Recovered materials (cobalt, nickel, lithium, lead) have salvage value; recycling partners may offset disposal costs.
- Consider refurbished packs for non-critical demo robots after proper testing and certification.
Allbotix coordinates end‑of‑life logistics and can include recycling and take‑back options in service agreements to simplify compliance for clients.
When to replace: practical thresholds and scheduling
- Immediate replacement: battery fails BMS safety checks, shows cell faults, or poses thermal risk.
- Priority replacement: capacity <70–80% and runtime no longer meets operational SLA.
- Planned replacement: predictive alert estimates remaining useful life < X weeks (X defined by site criticality) so swaps can be scheduled during low-impact windows.
For fleets, Allbotix recommends condition-based triggers combined with scheduled checkpoints (quarterly SoH reviews) and at least one spare pack per 5–10 high-utilization robots as a starting guideline.
How Allbotix helps you manage robot battery replacement cost
Allbotix engineers and deploys a diverse fleet of 525+ robots across 180+ clients with 99.8% uptime — pairing precision-engineered hardware with proprietary AI fleet‑management and predictive maintenance software. That integrated approach reduces uncertainty in replacement scheduling, enables swappable-pack architectures where appropriate, and bundles support, warranty and recycling to minimize the total cost of ownership.
If you operate multi-site or high‑utilization fleets — from airports and warehouses to hospitals, retail and corporate campuses — Allbotix helps you:
- Quantify robot battery replacement cost for your specific fleet and duty cycle
- Design battery integration for swappability where beneficial
- Implement predictive replacement to eliminate unplanned downtime
- Manage recycling and compliance through vendor take‑back programs
Contact Allbotix to run a battery replacement cost assessment for your fleet, and get a tailored plan that balances capex, downtime risk and lifecycle sustainability. Reach out for a consultation and see how precision engineering and limitless innovation translate into lower TCO and higher uptime for your robotic operations.