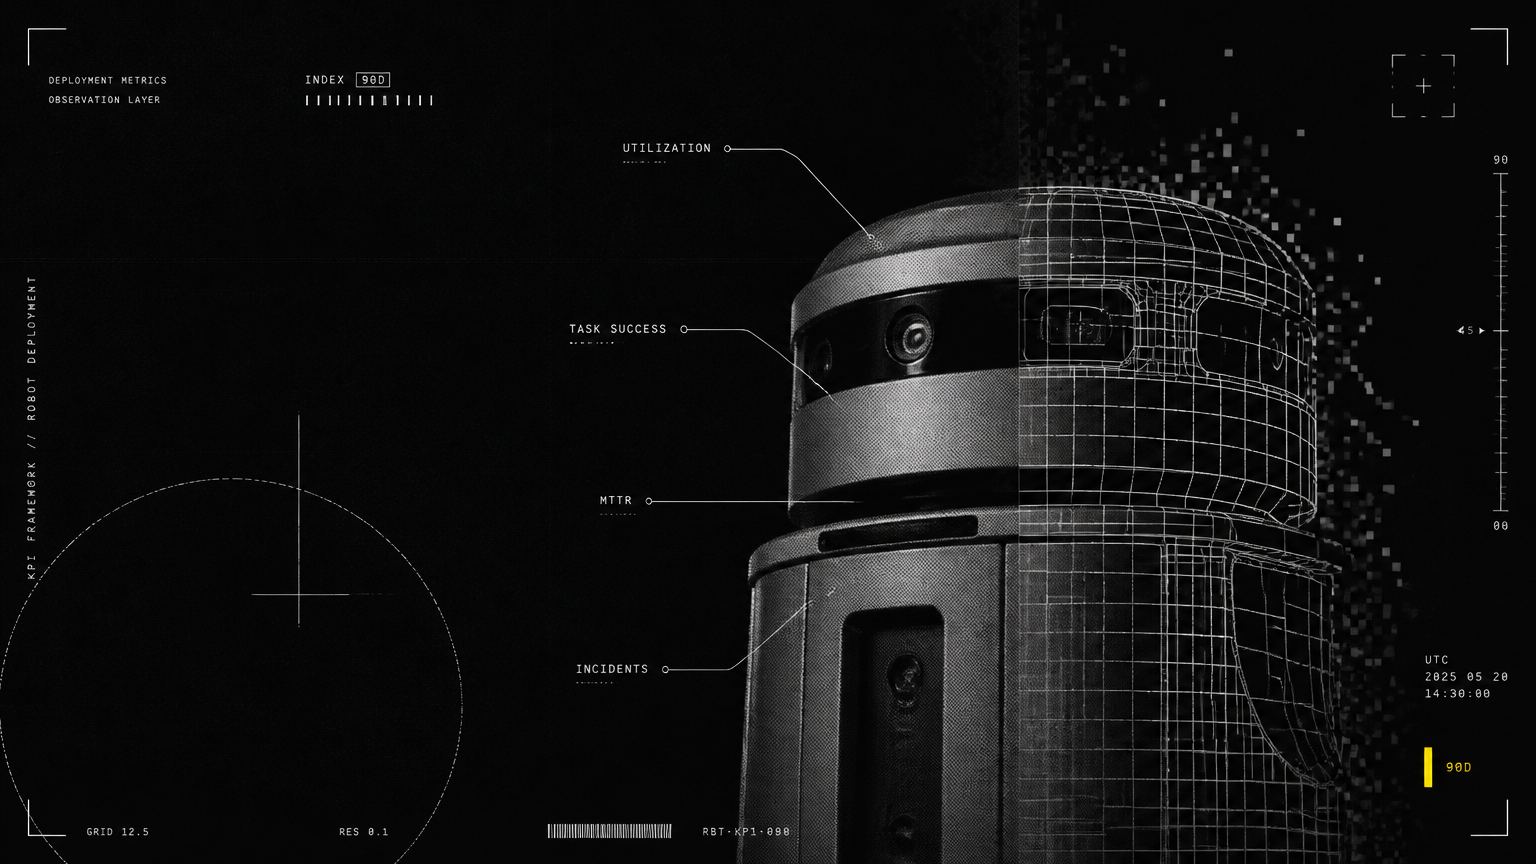
In the first 90 days focus on a short list of measurable operational and business KPIs — uptime/availability, utilization, task success rate, MTBF/MTTR, safety incidents, user/customer satisfaction, throughput/through-task time, and cost-per-task — and collect baseline data to enable quick optimizations. Use those early measurements to tune fleet-management and predictive-maintenance settings, set realistic targets by vertical, and feed dashboards/alerts so the deployment moves from “proof” to repeatable operation.
Part of our guide to Site Readiness & Deployment: Robot Site Survey Checklist: What We Assess Before Any Deployment.
Robot Deployment KPIs: What to Measure in the First 90 Days
Introduction Tracking the right robot deployment KPIs in the first 90 days separates a one-off trial from a scalable, repeatable program. Focus on a compact set of operational and business metrics you can measure automatically and act on daily or weekly. The goal in days 0–90 is not perfect performance — it’s accurate baselining, quick remediation of top failure modes, and documented improvement cycles so you can scale confidently.
Robot Deployment KPIs: Core operational metrics
These operational robot deployment metrics are the non-negotiables. Source them from robot telemetry, Allbotix fleet-management software (API/telemetry), building management systems, and incident logs.
- Uptime / Availability (robot uptime KPI)
- What: Percentage of scheduled-operational time that a robot is online and ready.
- How to measure: (Total available time − downtime) / Total scheduled time; use fleet-management heartbeat + task-scheduler logs.
- Data source & cadence: Real-time telemetry; daily and rolling-7/30-day summaries.
- Early 90-day aim: establish baseline; target improvement trajectory (example ranges by vertical below).
- Utilization
- What: Percentage of time the robot is actively performing meaningful tasks vs idle.
- How to measure: Active task time / Scheduled time (or 24hr time if continuous).
- Data source & cadence: Task logs, session traces; update daily, evaluate weekly.
- Task Success Rate
- What: % of dispatched tasks completed without operator intervention or escalation.
- How to measure: Completed tasks / Dispatched tasks; include partial-fail categories.
- Data source & cadence: Task-event logs + operator/manual overrides; daily/weekly.
- Mean Time Between Failures (MTBF) & Mean Time To Repair (MTTR)
- What: MTBF = average operating time between failure events. MTTR = average time to restore to service.
- How to measure: Event logs and ticket timestamps; maintain severity tagging.
- Data source & cadence: Fleet-management + support ticket system; compute rolling 30/90-day.
- Throughput / Task Time (per-task cycle time)
- What: Tasks completed per hour, or average time to finish a task (e.g., delivery route, cleaning pass).
- How to measure: Task start/end timestamps from fleet-manager.
- Data source & cadence: Telemetry; daily and shift-based reporting.
- Energy & Consumables Usage
- What: Battery cycles, energy per task, consumable replacements.
- How to measure: Battery telemetry, charging logs, consumable inventory events.
- Cadence: Per-charge and weekly aggregate.
- Safety Incidents & Near-Misses
- What: Collisions, trips, emergency stops, safety sensor triggers, and reported near-misses.
- How to measure: Safety logs, incident reports, video/RTLS cross-checks.
- Cadence: Real-time alerts + weekly summarized review.
- Sensor/Localization Health (navigation error rate)
- What: Frequency of localization loss, re-localization events, failed path planning attempts.
- How to measure: Navigation subsystem logs and SLAM error counters.
How to capture automatically
- Use Allbotix’s proprietary AI fleet-management software to ingest telemetry, event streams, and alerts. Integrate with CMMS, BMS, POS, and HR/payroll where appropriate to map operational events to business outcomes.
- Instrument dashboards with rolling windows (24h, 7d, 30d) and automate anomaly alerts (spike in MTTR, drop in uptime >2% week-over-week).
Robot Deployment KPIs: Business & adoption metrics
Map operational metrics to business outcomes — this is what stakeholders care about.
- Cost-per-task
- What: All-in cost (amortized robot capex + opex + consumables + support) divided by tasks performed.
- How to measure: Combine financial depreciation schedule, power/consumables costs, and support hours with task counts. Monthly cadence.
- Labor Substitution / FTE-equivalent savings
- What: Estimated full-time-equivalent hours replaced or redirected due to robot tasks.
- How to measure: Compare pre-deployment labor hours for identical tasks vs post-deployment robot task time; use payroll/scheduling data.
- Customer / User Satisfaction (adoption)
- What: NPS, CSAT, internal ticket volumes, or guest/service feedback specific to robot interactions.
- How to measure: Short surveys post-interaction, IVR/QR feedback, helpdesk ticket counts. Weekly and 30/90-day reports.
- Throughput & Service Level Improvements
- What: Measurable increases in deliveries/cleaning passes/visitor-handling per shift.
- How to measure: Task throughput vs baseline period; correlate with footfall or order volume.
- Safety & Compliance Benefits
- What: Reductions in incidents, OSHA-reportable events, or infection-risk transfers (healthcare).
- How to measure: Incident logs and compliance reports; evaluate quarterly but capture 90-day trend.
Vertical expectations (90‑day baselines and early targets) The table below provides realistic early targets and baselines for "robot deployment KPIs first 90 days" by vertical. These are starting points for tuning; your site-specific environment will vary.
| Vertical | Typical 90‑day uptime target | Utilization target (first 90d) | Task success rate target | Notes / what to expect |
|---|---|---|---|---|
| Corporate campuses / Offices | 96–99% | 25–50% of working hours | 92–98% | Peak footfall patterns drive utilization; focus on receptionist/ delivery windows |
| Retail / Malls | 95–98% | 40–70% during open hours | 90–96% | Busy times stress navigation & charging strategy |
| Healthcare (hospitals) | 98–99.5% | 30–60% | 94–99% | Higher uptime & safety expectations; strict logging and sanitization cycles |
| Hospitality (hotels, restaurants) | 95–99% | 30–60% | 92–97% | Seasonal/peak events affect utilization; guest satisfaction key |
| Manufacturing & Production | 97–99% | 50–85% | 93–98% | Integration with PLCs and conveyors matters; MTBF critical |
| Logistics & Warehousing (AMR) | 95–99% | 60–90% | 90–97% | High utilization achievable; focus on route congestion & battery swaps |
| Airports & Transit Hubs | 95–99% | 40–80% | 90–96% | Stringent safety/reporting; planning for crowded transient flows |
| Government / Public Services | 95–99% | 20–60% | 90–97% | 24/7 coverage needs robust redundancy |
| Education (campus) | 95–98% | 20–50% | 90–95% | Scheduling by class/term affects usage |
Note: Allbotix’s fleet-level performance history (525+ robots, 180+ clients, 99.8% uptime across managed deployments) is a reference point for mature operations — early pilots should focus on progression toward those levels.
Comparative lens: AMR deployment KPIs vs Service robot KPIs
When planning, differentiate measurements and targets by platform. The table below summarizes common differences and first-90-day focuses.
| Criterion | AMR deployment KPIs | Service robot KPIs (receptionist, serving, cleaning) |
|---|---|---|
| Primary uptime sensitivity | Battery/traffic & dock scheduling | Network connectivity & interaction flow |
| Typical utilization in 90 days | 60–90% during shifts | 20–70% (peaks tied to service hours) |
| Key task success metric | Delivery accuracy / dock success % | Interaction completion / customer handoff % |
| MTBF focus | Drive system, odometry, payload handling | Voice/UI, manipulation hardware, cleaning heads |
| Top data sources | Navigation logs, battery telemetry, route retries | Interaction logs, touchpoints, call escalation rates |
| Early optimization lever | Traffic routing, charge scheduling, path smoothing | UX tuning, human-in-loop fallback, placement & prompts |
Robot fleet performance metrics: measurement cadence & dashboards
What to display on day 1 dashboards
- Live fleet map: robot location + state (idle, working, charging, error).
- Uptime & availability: current day, 7d, 30d numbers.
- Task pipeline: queued, in-progress, failed.
- MTTR & open tickets by severity.
- Safety incidents & near-miss heatmap.
- Energy & battery health trending.
Recommended cadence
- Real-time: alerts for safety incidents, critical errors, emergency stops.
- Daily: utilization, task success, battery cycles.
- Weekly: MTBF/MTTR, minor incident trends, service-level comparisons.
- 30/90-day: cost-per-task, labor substitution, adoption metrics.
Automated alert rules (examples)
- Notify ops if fleet uptime drops >2% vs rolling 7-day average.
- Trigger high-priority ticket if a robot has >3 navigation re-localizations in 1 hour.
- Flag battery health when average cycles-to-charge drops 15% vs baseline.
- Predictive-maintenance trigger: vibration sensor threshold + spike in motor current sustained for 10 minutes.
90-day governance & optimization playbook
A compact governance plan turns telemetry into reliable performance.
Phase 0 — Pre-deploy checklist (Days −7 to 0)
- Define deployment KPIs and owners (ops, engineering, facilities, safety).
- Integrate Allbotix fleet-management with site systems (BMS, CMMS, POS).
- Create dashboards and set initial alert thresholds (conservative).
Phase 1 — Baseline & stability (Days 0–30)
- Run continuous logging; collect telemetry and incident tickets.
- Triage top 3 failure modes; implement quick fixes (path smoothing, charge schedule changes, UI prompts).
- Start weekly ops review with stakeholders.
Phase 2 — Optimization & predictive maintenance (Days 30–60)
- Use measured MTBF/MTTR to tune spare parts inventory and dispatch SLAs.
- Enable predictive-maintenance rules in fleet-manager (battery cycle forecasting, vibration anomalies).
- Start A/B experiments (different routes, docking locations, interaction scripts).
Phase 3 — Scale readiness & SOPs (Days 60–90)
- Document SOPs for daily ops, incident escalation, and maintenance tasks.
- Lock initial KPIs for production run; review cost-per-task and ROI trajectory.
- Create multi-site playbook if roll-out is planned across locations.
Immediate actions when metrics fall short
- If uptime drops >3% in a week: isolate by robot/zone, switch affected units to safe-mode, escalate to Allbotix Premium Support (24/7), patch firmware if needed, re-route fleet.
- If task success < target by >10%: capture failure traces + video, roll back recent config changes, add human-in-loop for high-impact tasks, retrain perception models if misclassifications dominate.
- If MTTR is high: audit spare parts & tools, refine remote-restart routines, train local techs, reduce severity-to-engineer escalation time.
- If utilization is low: review task scheduling, co-locate robots to high-demand areas, adjust scheduling windows, and revise UI/prompts to increase user engagement.
Practical tips to accelerate improvement
- Instrument video or RTLS sampling for root-cause analysis of navigation/safety incidents.
- Keep at least 1 hot spare per 8–12 production robots in early fleets.
- Use lightweight surveys (single-question CSAT) immediately after robot interaction to surface adoption issues.
- Treat first 90 days as a continuous improvement sprint with weekly retrospectives.
Why Allbotix’s approach matters here Allbotix engineers both hardware and a proprietary AI fleet-management layer in-house — this tight integration enables rapid access to telemetry, faster firmware fixes, and bespoke predictive-maintenance rules tuned to your exact robot models and workflows. With 525+ robots developed, 180+ clients, and a documented fleet uptime of 99.8% in managed deployments, Allbotix combines precision engineering with limitless innovation to shrink your pilot-to-scale timeline. Backed by Nanta Tech Limited and supported with 24/7 Premium Support, our teams focus on metrics that matter — not just for robotics enthusiasts but for operational leaders in corporate, healthcare, retail, logistics, education, hospitality, government, airports, and manufacturing.
Closing / Next steps Start your first 90-day KPI program with a compact dashboard mapping the eight core metrics above, assign clear owners for each KPI, and set weekly review cadences. If you want a tried-and-tested playbook, Allbotix can help instrument your deployment, tune predictive-maintenance rules, and accelerate movement from “proof” to repeatable operation — backed by our engineering-first approach and global support.
Contact Allbotix to set up a KPI-driven pilot, get a custom 90-day optimization plan, or have our team integrate your fleet with best-practice dashboards and alerts. Limitless innovation. Precision engineering. 24/7 Premium Support.